Adam J Campbell PhD
HOW-TO: Create a data graphic for Wikipedia
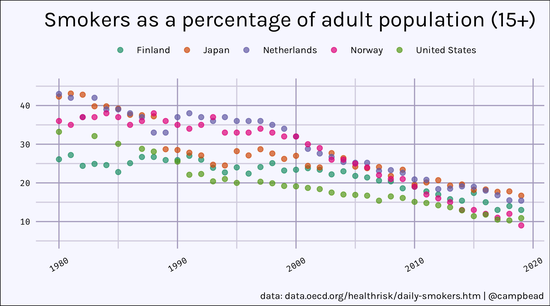
I recently was browsing Wikipedia and noticed this outdated data graphic: The data only covered a limited range and the style left something to be desired. I decided update this graphic with newer data and give it my own style.

Wowchemy customisations
I’ve recently changed this site over to the new Wowchemy theme (formerly Hugo Academic). With that change, I’ve made a few customisations along the way to the theme that I’d like to share.
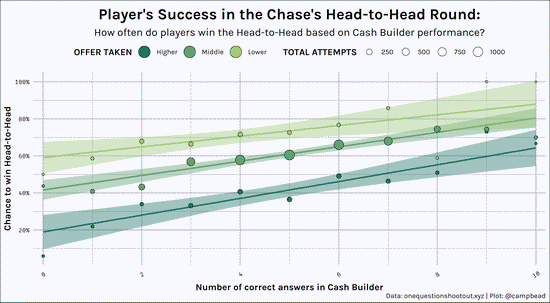
The Chase
A deep dive into trends and analysis of the TV’s The Chase

Game Jam - Red Rover: Research & Repair
A few years ago I was lucky enough to participate in a Game Jam where I got to work with a few very talented individuals. We combined our expertise and were able to produce a pretty fun little game all the span of 48 hours.
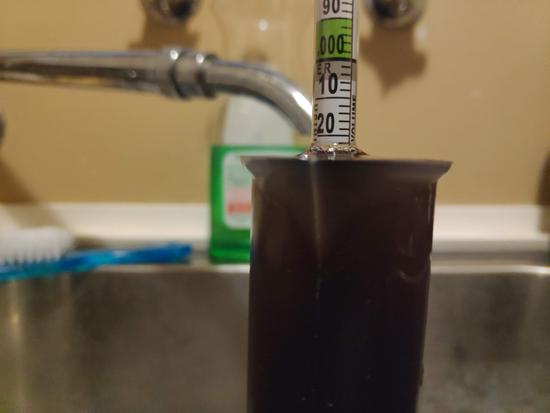
How much alcohol is in your homebrew?
I make beer as a hobby. It’s something I’ve been doing for over a decade and throughout the years my beer has improved dramatically. One thing that I really like about beer making is the mathematical detail involved.
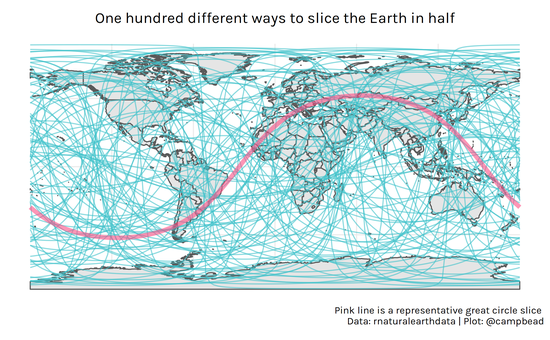
Different ways to slice the Earth
About 2/3’s the Earth’s land in is the northern hemisphere. How would that change if the equator were in a different location
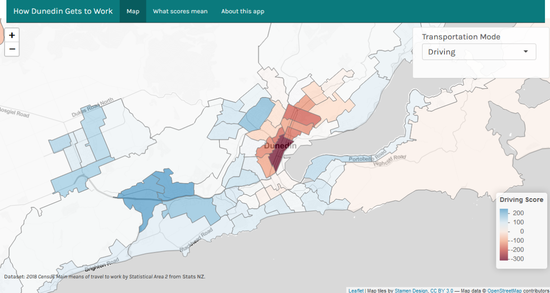
How Dunedin Gets to Work
I recently participated in the There and Back Again data visualisation competition from Stats NZ. I wanted to quickly make a post to feature the app I made, called How Dunedin Gets to Work.
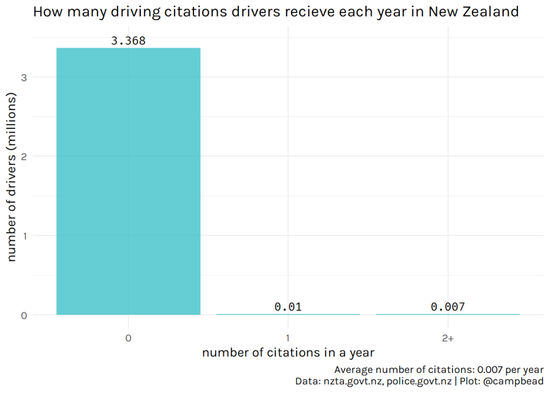
Most Drivers are Better than Average
Can most drivers be better than average?
Scraping Wikpedia Tables
A quick how-to guide on scraping tables from Wikipedia, using R.
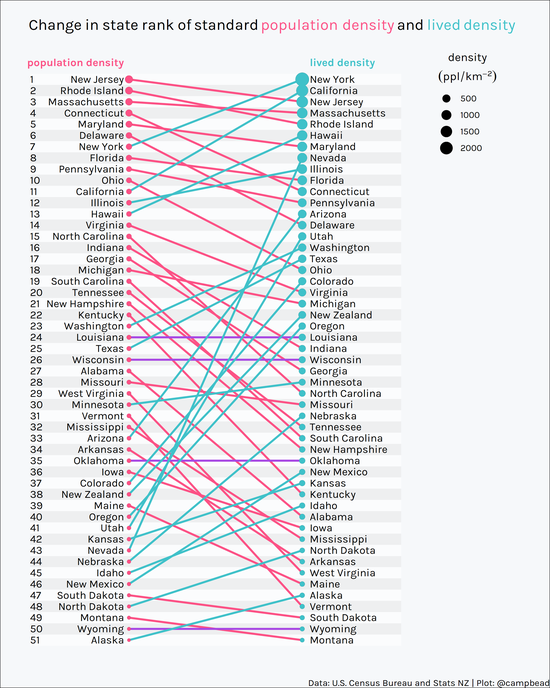
What is the population density of New Zealand?
Recently, it has been argued that New Zealand’s success with dealing with Covid-19 has been due, in part, to its low population density. New Zealand’s population density is around 17.
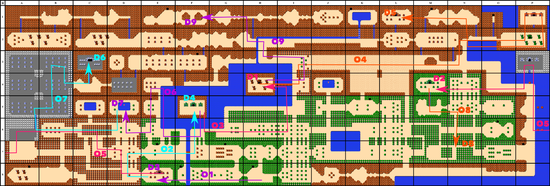
Legend of Zelda speedrunning— Which rooms kill runs?
Note: this article was originially published on Medium. This is the part 2 of my series on analyzing speedrunning of Legend of Zelda (check out part 1: Legend of Zelda speedrunning — top 5 time wasting rooms)
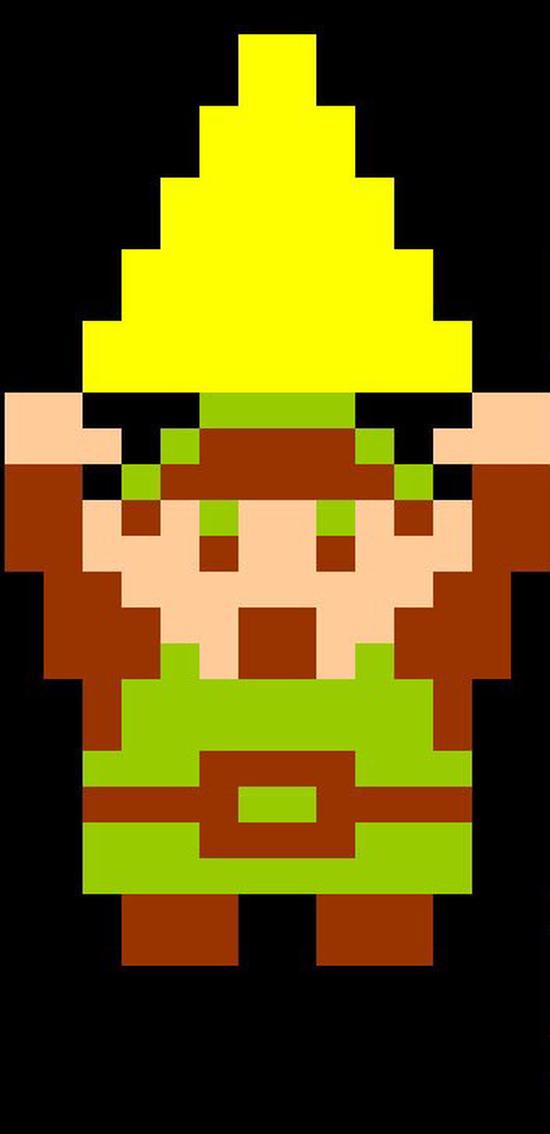
Legend of Zelda speedrunning — top 5 time wasting rooms
Note: this article was originially published on Medium. A few months ago I discovered the Retro channel on Twitch where folks play a lot of classic NES and SNES video games that I remember fondly from my childhood.