Recently, it has been argued that New Zealand’s success with dealing with Covid-19 has been due, in part, to its low population density. New Zealand’s population density is around 17.7 people per square kilometer, but just how dense is that number? If New Zealand’s population density were compared to US states, New Zealand would down rank toward the bottom in terms of population density. However population density, as it is normally calculated is not necessarily the best representation of densely people live in a region, state, or nation. In fact, the average person in New Zealand lives in a place with a population density of 425.4 people per square kilometer. This measure of density, called a lived density is a better metric to evaluate population density.
Lived density over population density
Lived density is the population density experienced by the average person in the region. For example the population density of New York State is 161 people per square-kilometer, but the average New York State resident lives in an area with 2,479 people per square-kilometer (the lived density). There are a number of different ways to compute this number. Inspired by the following tweet from Ryan Moulton, I computed the KL-divergence between the population distribution and the area distribution.
This has a formal name. It's the KL-divergence between the distribution of people and the distribution of land across census tracts.
— Ryan Moulton (@moultano) November 29, 2019
I plan on going into detail on this a future post, in the meantime I’ve made the source code available for this calculation.
Pinksvile and Bluetopia
Let’s start by considering two hypothetical cities: Pinksville and Bluetopia. Both cities are exactly 25 square-kilometers in area, and both cites have 25 residents. Using a traditional measure of population density, where the total population is divided by the total area, these cities are indistinguishable. However, if you take a closer look at figure below you’ll notice these cities are quite different in their population structure.
Population distributions for Pinksville and Bluetopia
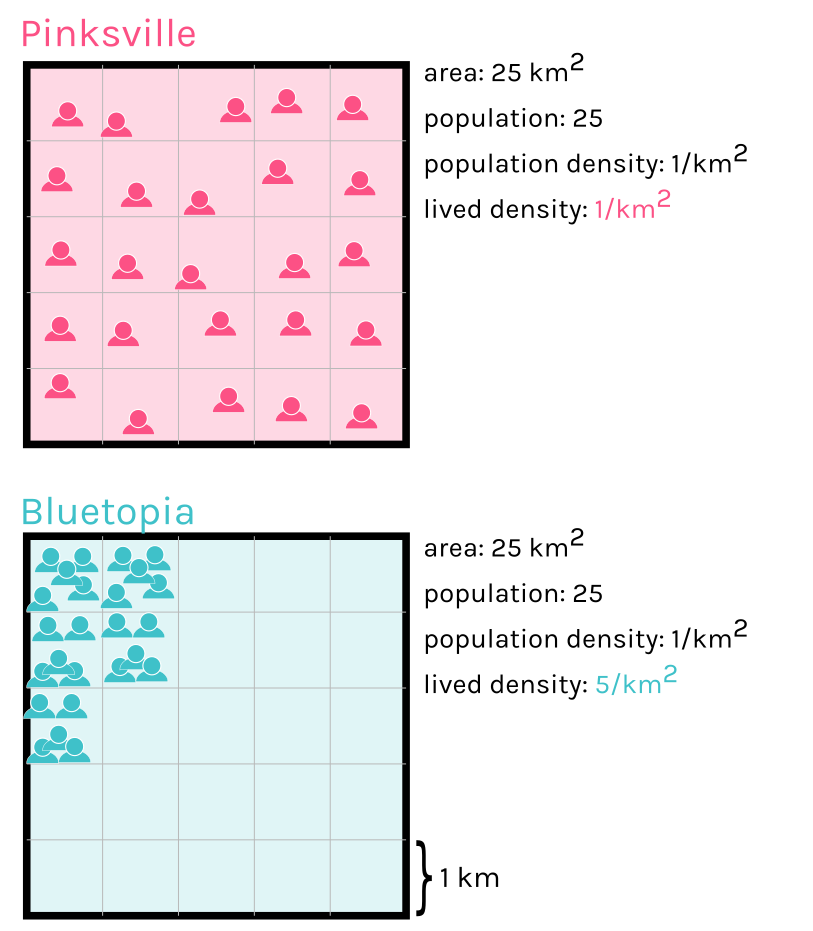
In Pinksville, people are very spread apart - indeed in every single square-kilometer of Pinksville, resides exactly one person. This stands in contrast to Bluetopia, where the entire population lives in a 4 square-kilometer corner of the city, while the remainder of the city is uninhabited. It turns out that cities, states and countries have population distributions that resemble Bluetopia where people live in clusters more then they represent Pinksville where everyone is smoothly distributed. Lived density is a better measure because it represents the density for which most people experience.
How New Zealand ranks
I’ve computed the population density, lived density, and density ratio for all 50 US states and New Zealand. This is an interactive table so you’ll be able to sort by the different columns as you desire.
Population density, lived density, and their ratio
*areas are in km2 and densities are in people/km2, Ratio is lived density divided by population density.
By inspecting the ratio between the lived density and population density, some states stand out. Alaska has a lived density that is over one hundred times its population density. At the other end, Vermont only has a lived density just over twice its population density. It’s worth noting that the this ratio can never be less than one. A ratio of one would mean the population is perfectly spread out of over the state, like the Pinksville example.
Ranking states by density vs lived density
We can compare the relative way ranking changes in population density vs lived density in the slopegraph below.
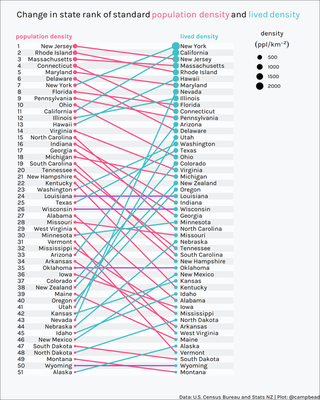
Many states rankings don’t change much going from population density measure to a lived density, but there are some major changes here. Most notable is Nevada that goes from nearly the bottom in terms of population density to near the top for the lived density rankings. New Zealand is included in this ranking and rises a considerable number of places.
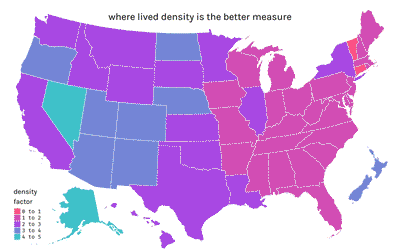
Spatial patterns in lived density ratio
If we map the spatial pattern in the lived density ratio, we can see that Western states are have a larger ratio than Eastern states. Here I use a logarithmic scale of density ratio to color the map, which I call the density factor.
Takeaways
-
Lived density is a better way of computing population density when what you care about is how many people the average person lives near. Which is probably the case for modeling disease spread.
-
If New Zealand were a US State it would rank near the middle in terms of lived density and near the bottom in terms of population density.
-
The ratio of lived density to population density gives a measure of how clustered people live in a region.
Adam J Campbell PhD
Data Science | Geospatial | Data Storytelling
I’m a data professional interested in visualisation, automation,statistical problem solving, and storytelling.