HOW-TO: Create a data graphic for Wikipedia
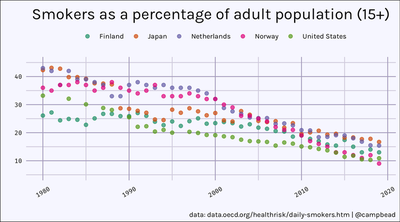
I recently was browsing Wikipedia and noticed this outdated data graphic:

The data only covered a limited range and the style left something to be desired. I decided update this graphic with newer data and give it my own style. I was able to easily locate the data using the source provided in the image so I knew that this project would be possible.
Step 1 - Creating the graphic
To create the graphic I use R with the ggplot2 package, I won’t go into too much detail here about generating the image but the code is availble on github. I used RColorBrewer for the point colors and camptheme for the theme. I think the final version turned out quite nicely.
But you can use any method you please to create the code to generate the image. Overall I’m happy with how it turned out.
Step 2 - Upload to Github
Once your code is ready, you can upload to Github. I won’t go into the details here but this is a good introduction to using Github if you need it.
The important part is to use the correct license with your Github Repository. Wikimedia Commons requires using a Creative Commons Attribution-ShareAlike 4.0 International license for the image, so I chose to use the same license for the code to generate the image.
Unfortunately, this license isn’t a default license on Github so you’ll have to generate the license yourself. However, I found a great resource to use the CC Attribution-ShareAlike 4.0 International license. That guide shows how to update your README.md and LICENSE files in your Github repository with the appropriate details.
Step 3 - Upload to Wikimedia
Now with your graphic created, and your code published, you can publish your graphic to Wikimedia Commons. First create an account if you don’t have one (this can also be used to edit Wikipedia). Secondly, navigate to Upload file under the Participate heading.
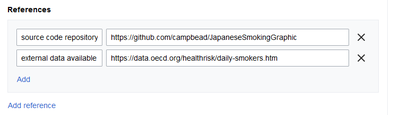
The page you guide you through the process. You’ll upload the image, certify it’s your own work, and then describe the image. Once you reach the Add data tab you’ll want to add two references. First add the link to your Github repository to the source code repository field, and add the link to the source data to the external data available field.
Step 4 - Edit the Wikipedia page
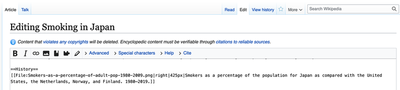
The last step is to go to the original Wikipedia page and update the reference from the outdated graphic to the new graphic.
Click on the Edit tab scroll to find the reference to the outdated graphic. Update the reference with your new filename and update the description.
That’s it! Great job. You’ve improved Wikipedia and made the world slightly more knowledgable.
Adam J Campbell PhD
Data Science | Geospatial | Data Storytelling
I’m a data professional interested in visualisation, automation,statistical problem solving, and storytelling.